Usage
The Usage menu displays statistics on the number of users related to your projects.
Overview
Click Usage in the console to display usage statistics as shown below.
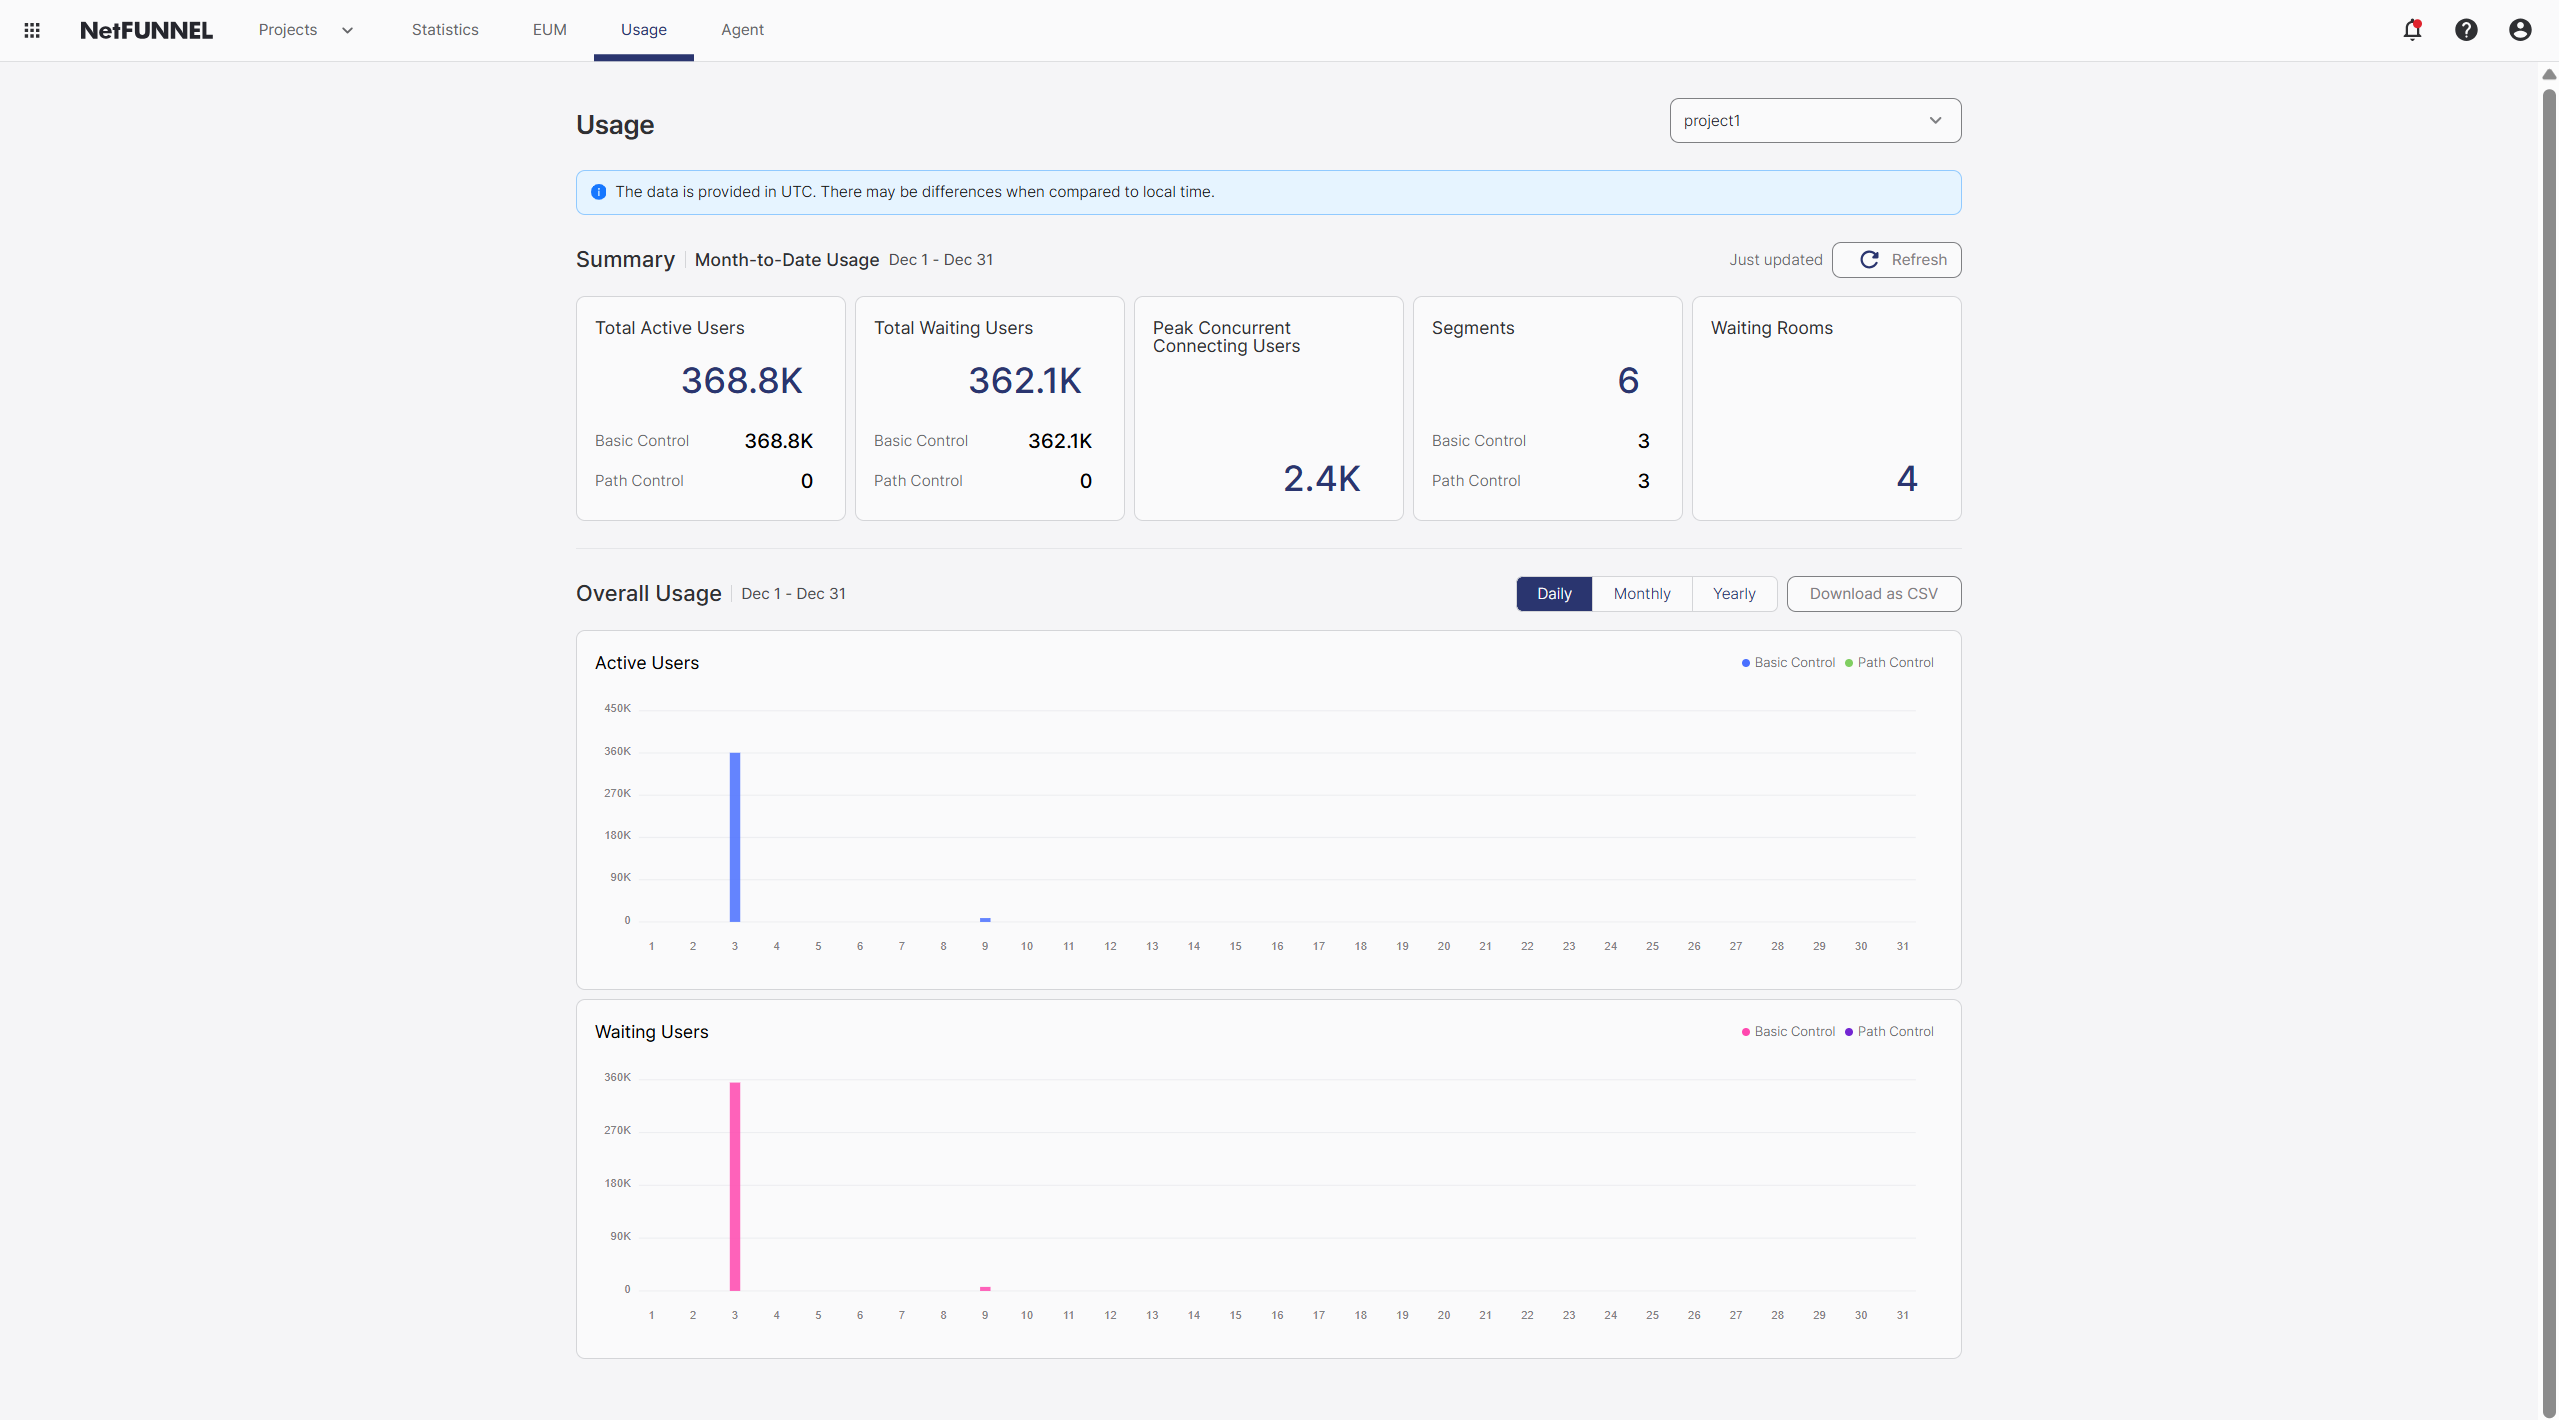
Summary
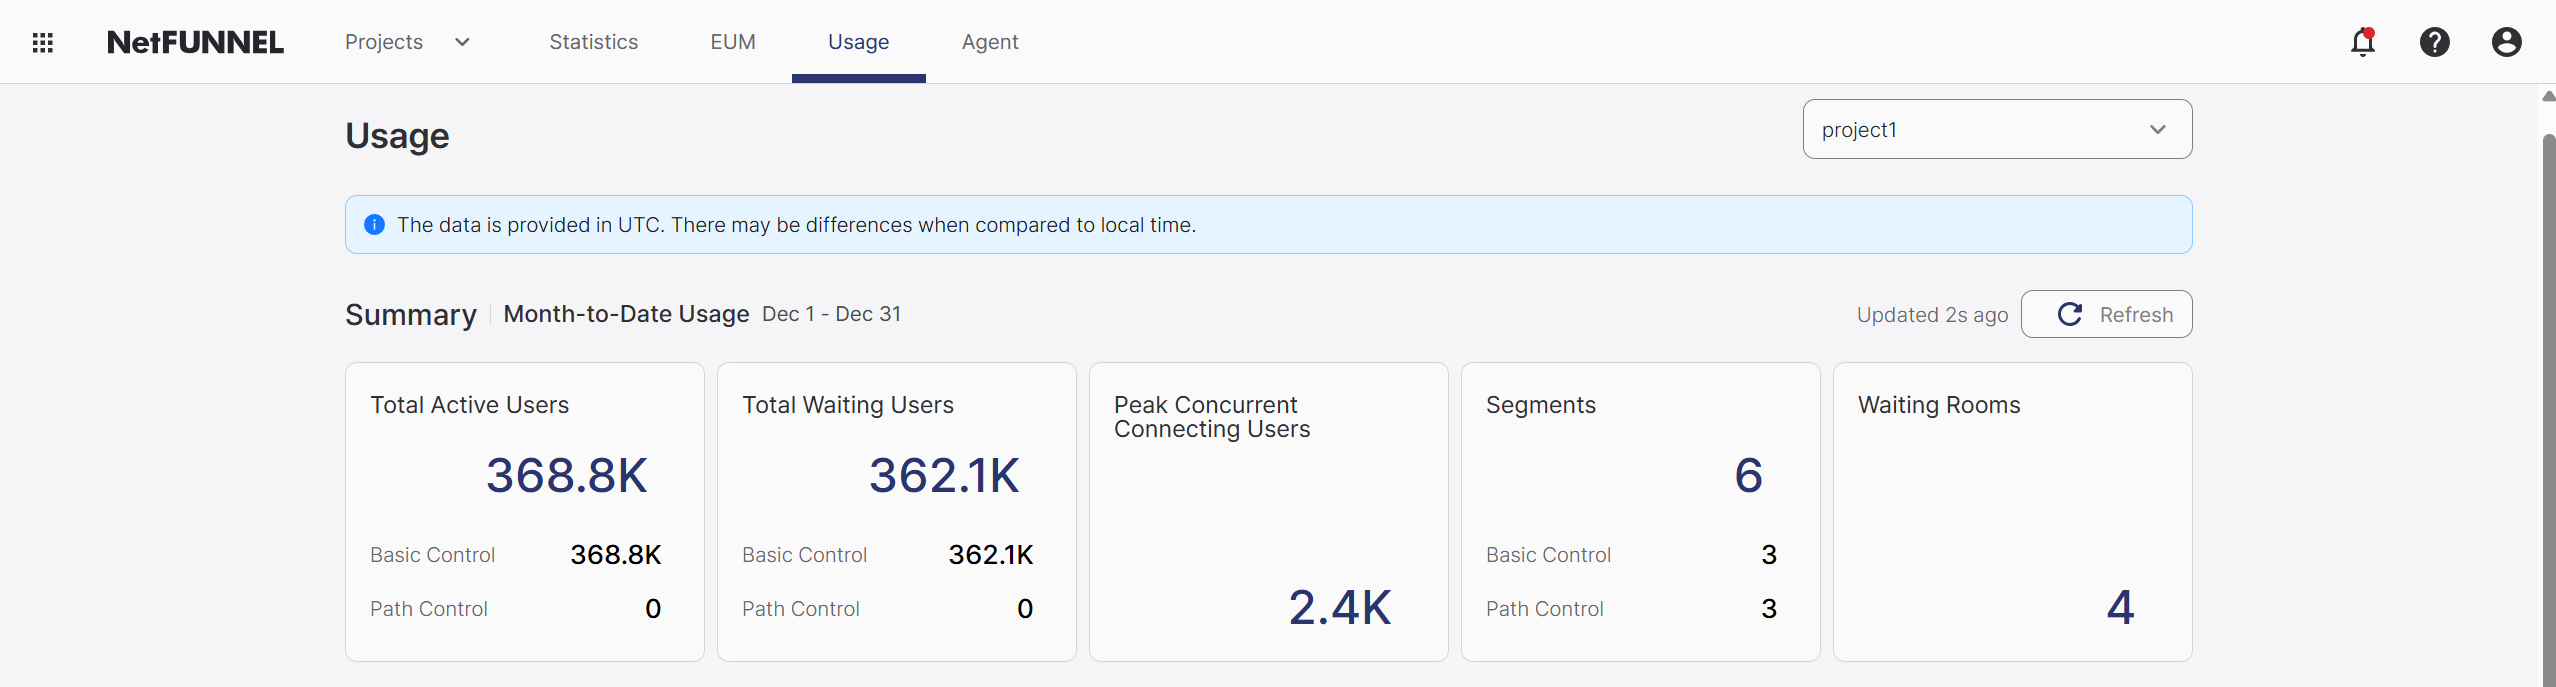
Monthly usage is displayed as itemized figures. You can update it at any time by refreshing. Hover over rounded values to see the specific numbers.
Total Active Users (MAU)
Total Active Users (Monthly Active User) is the count of users who sent their first entry request. Whether re-entry requests are counted depends on whether the Queue Position Retention feature is enabled.
When Queue Position Retention is enabled, MAU count does not increase even if users send re-entry requests within the set time period.
When Queue Position Retention is disabled, MAU count increases if users send re-entry requests after 60 seconds.
MAU values are reset at the monthly subscription renewal date.
Total Waiting Users
The number of end users who waited in the waiting room during the month. Users who received a PASS signal instead of a waiting signal and entered immediately are not counted.
Peak Concurrent Connecting Users
The number of users who attempted to connect simultaneously based on a 1-second interval. This displays the peak value for the month, so it may be updated during the month.
Segment
The total number of created segments. You can view the counts of Basic Control and Section Control segments separately.
Waiting Rooms
The sum of activated Waiting Room and Block Room counts.
Overall Usage
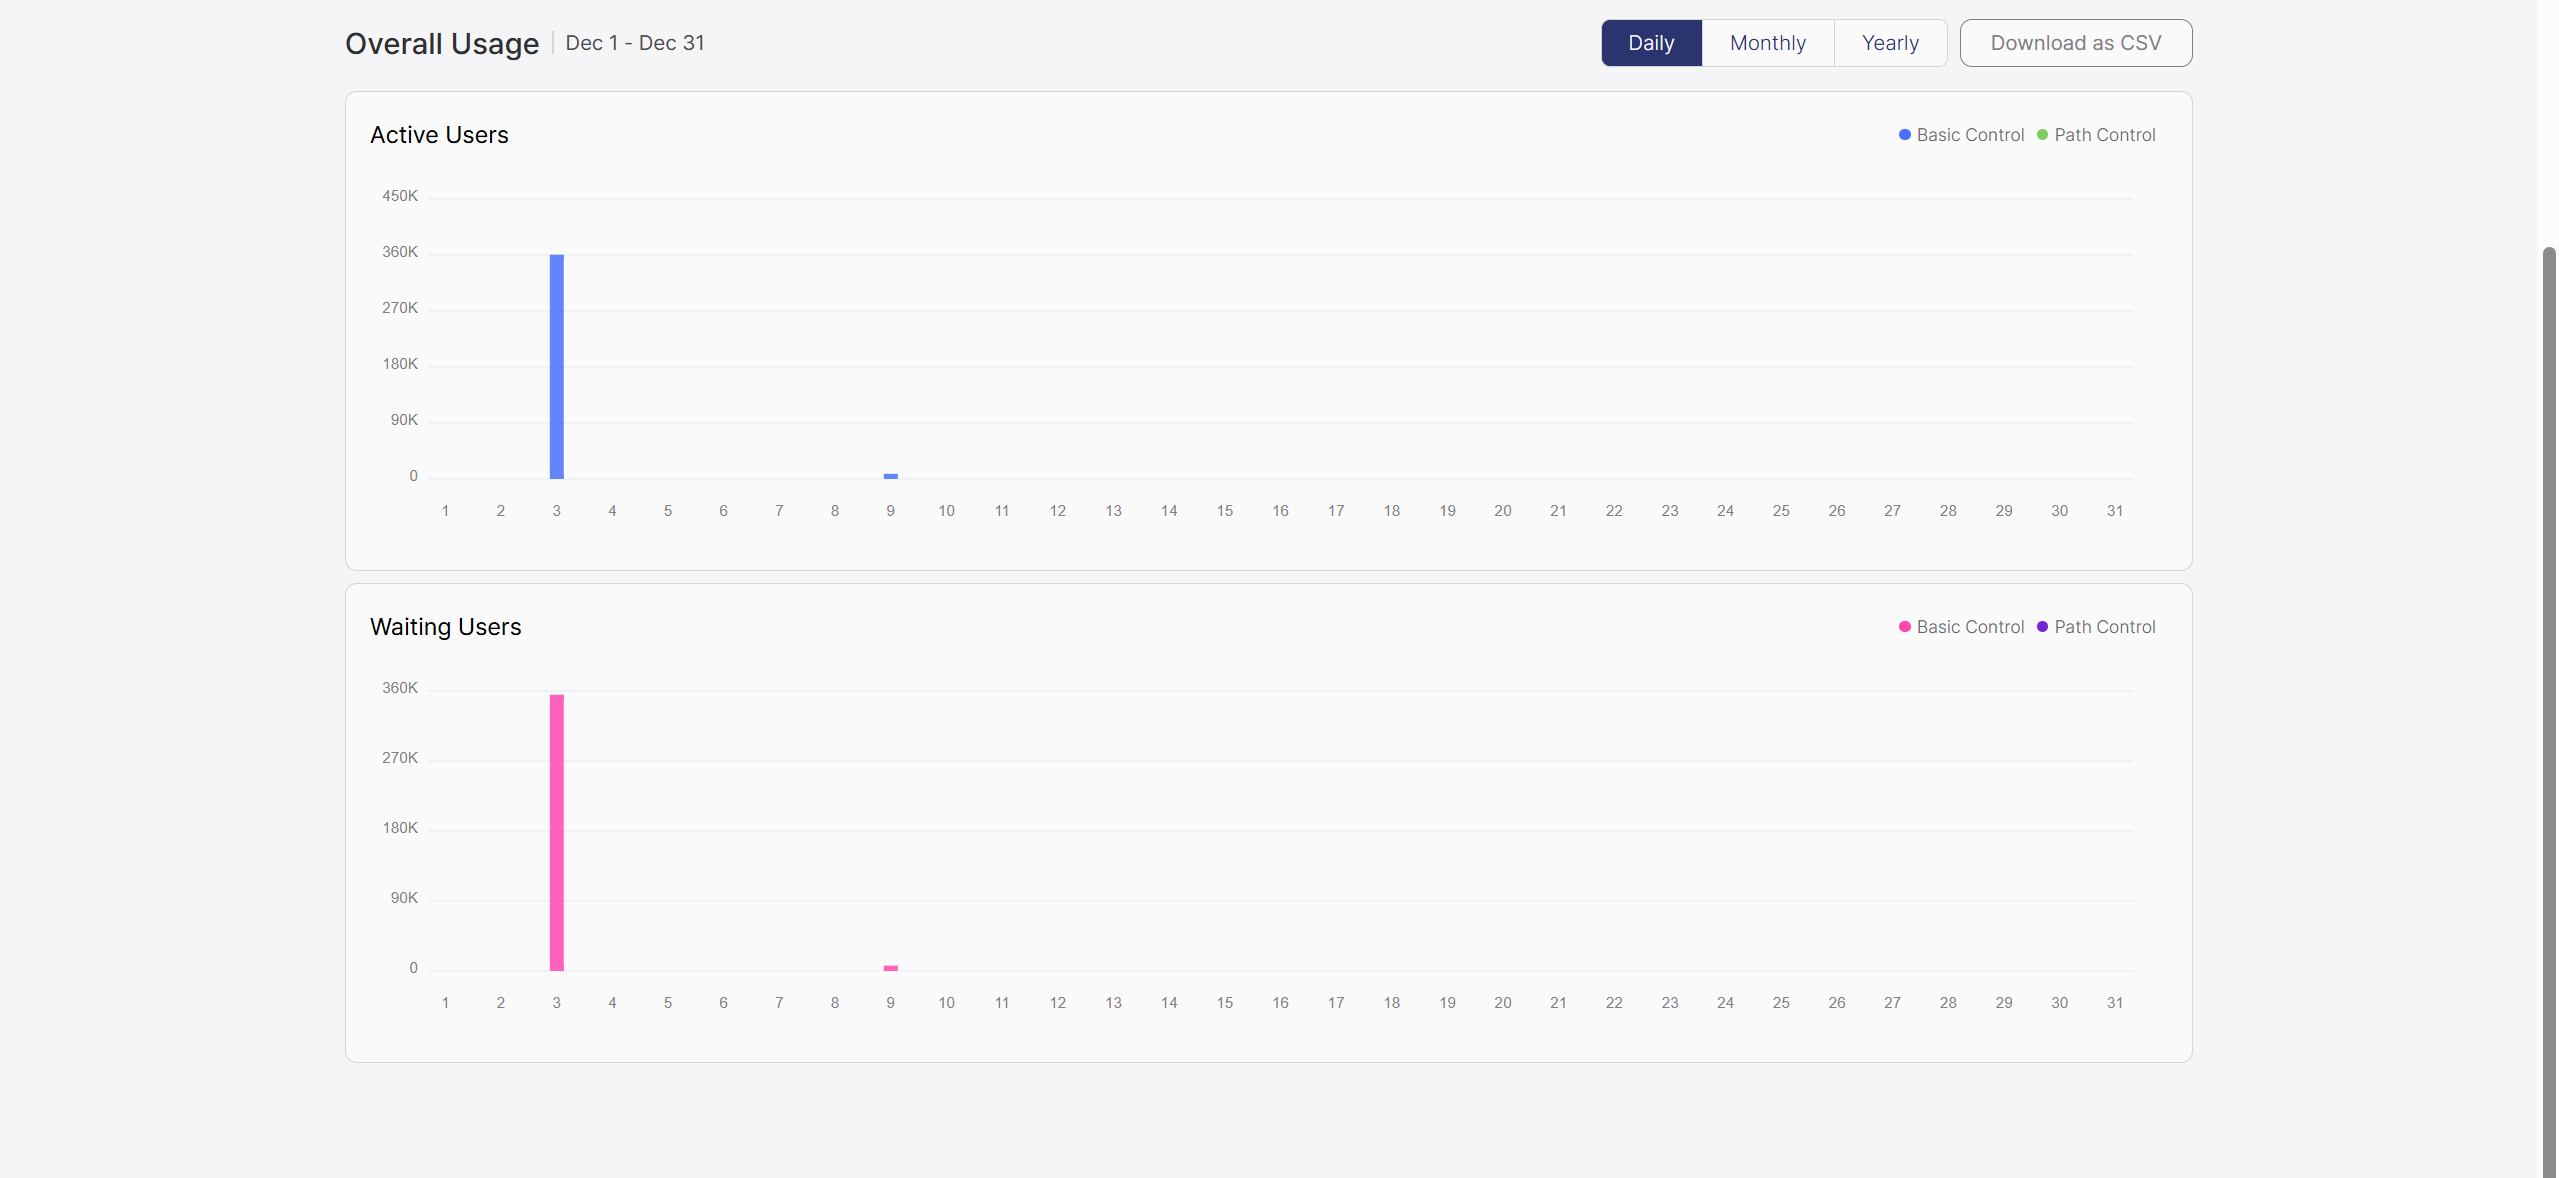
Usage is displayed as graphs for daily, monthly, and yearly periods. Related data can be downloaded in CSV format.
Active Users
A graph showing Active Users on a daily basis, allowing you to check daily MAU values. Values collected from Basic Control and Section Control segments are displayed separately.
Waiting Users
A graph showing Waiting Users on a daily basis, allowing you to check daily total waiting user values. Values collected from Basic Control and Section Control segments are displayed separately.