Integrated Log
Overview
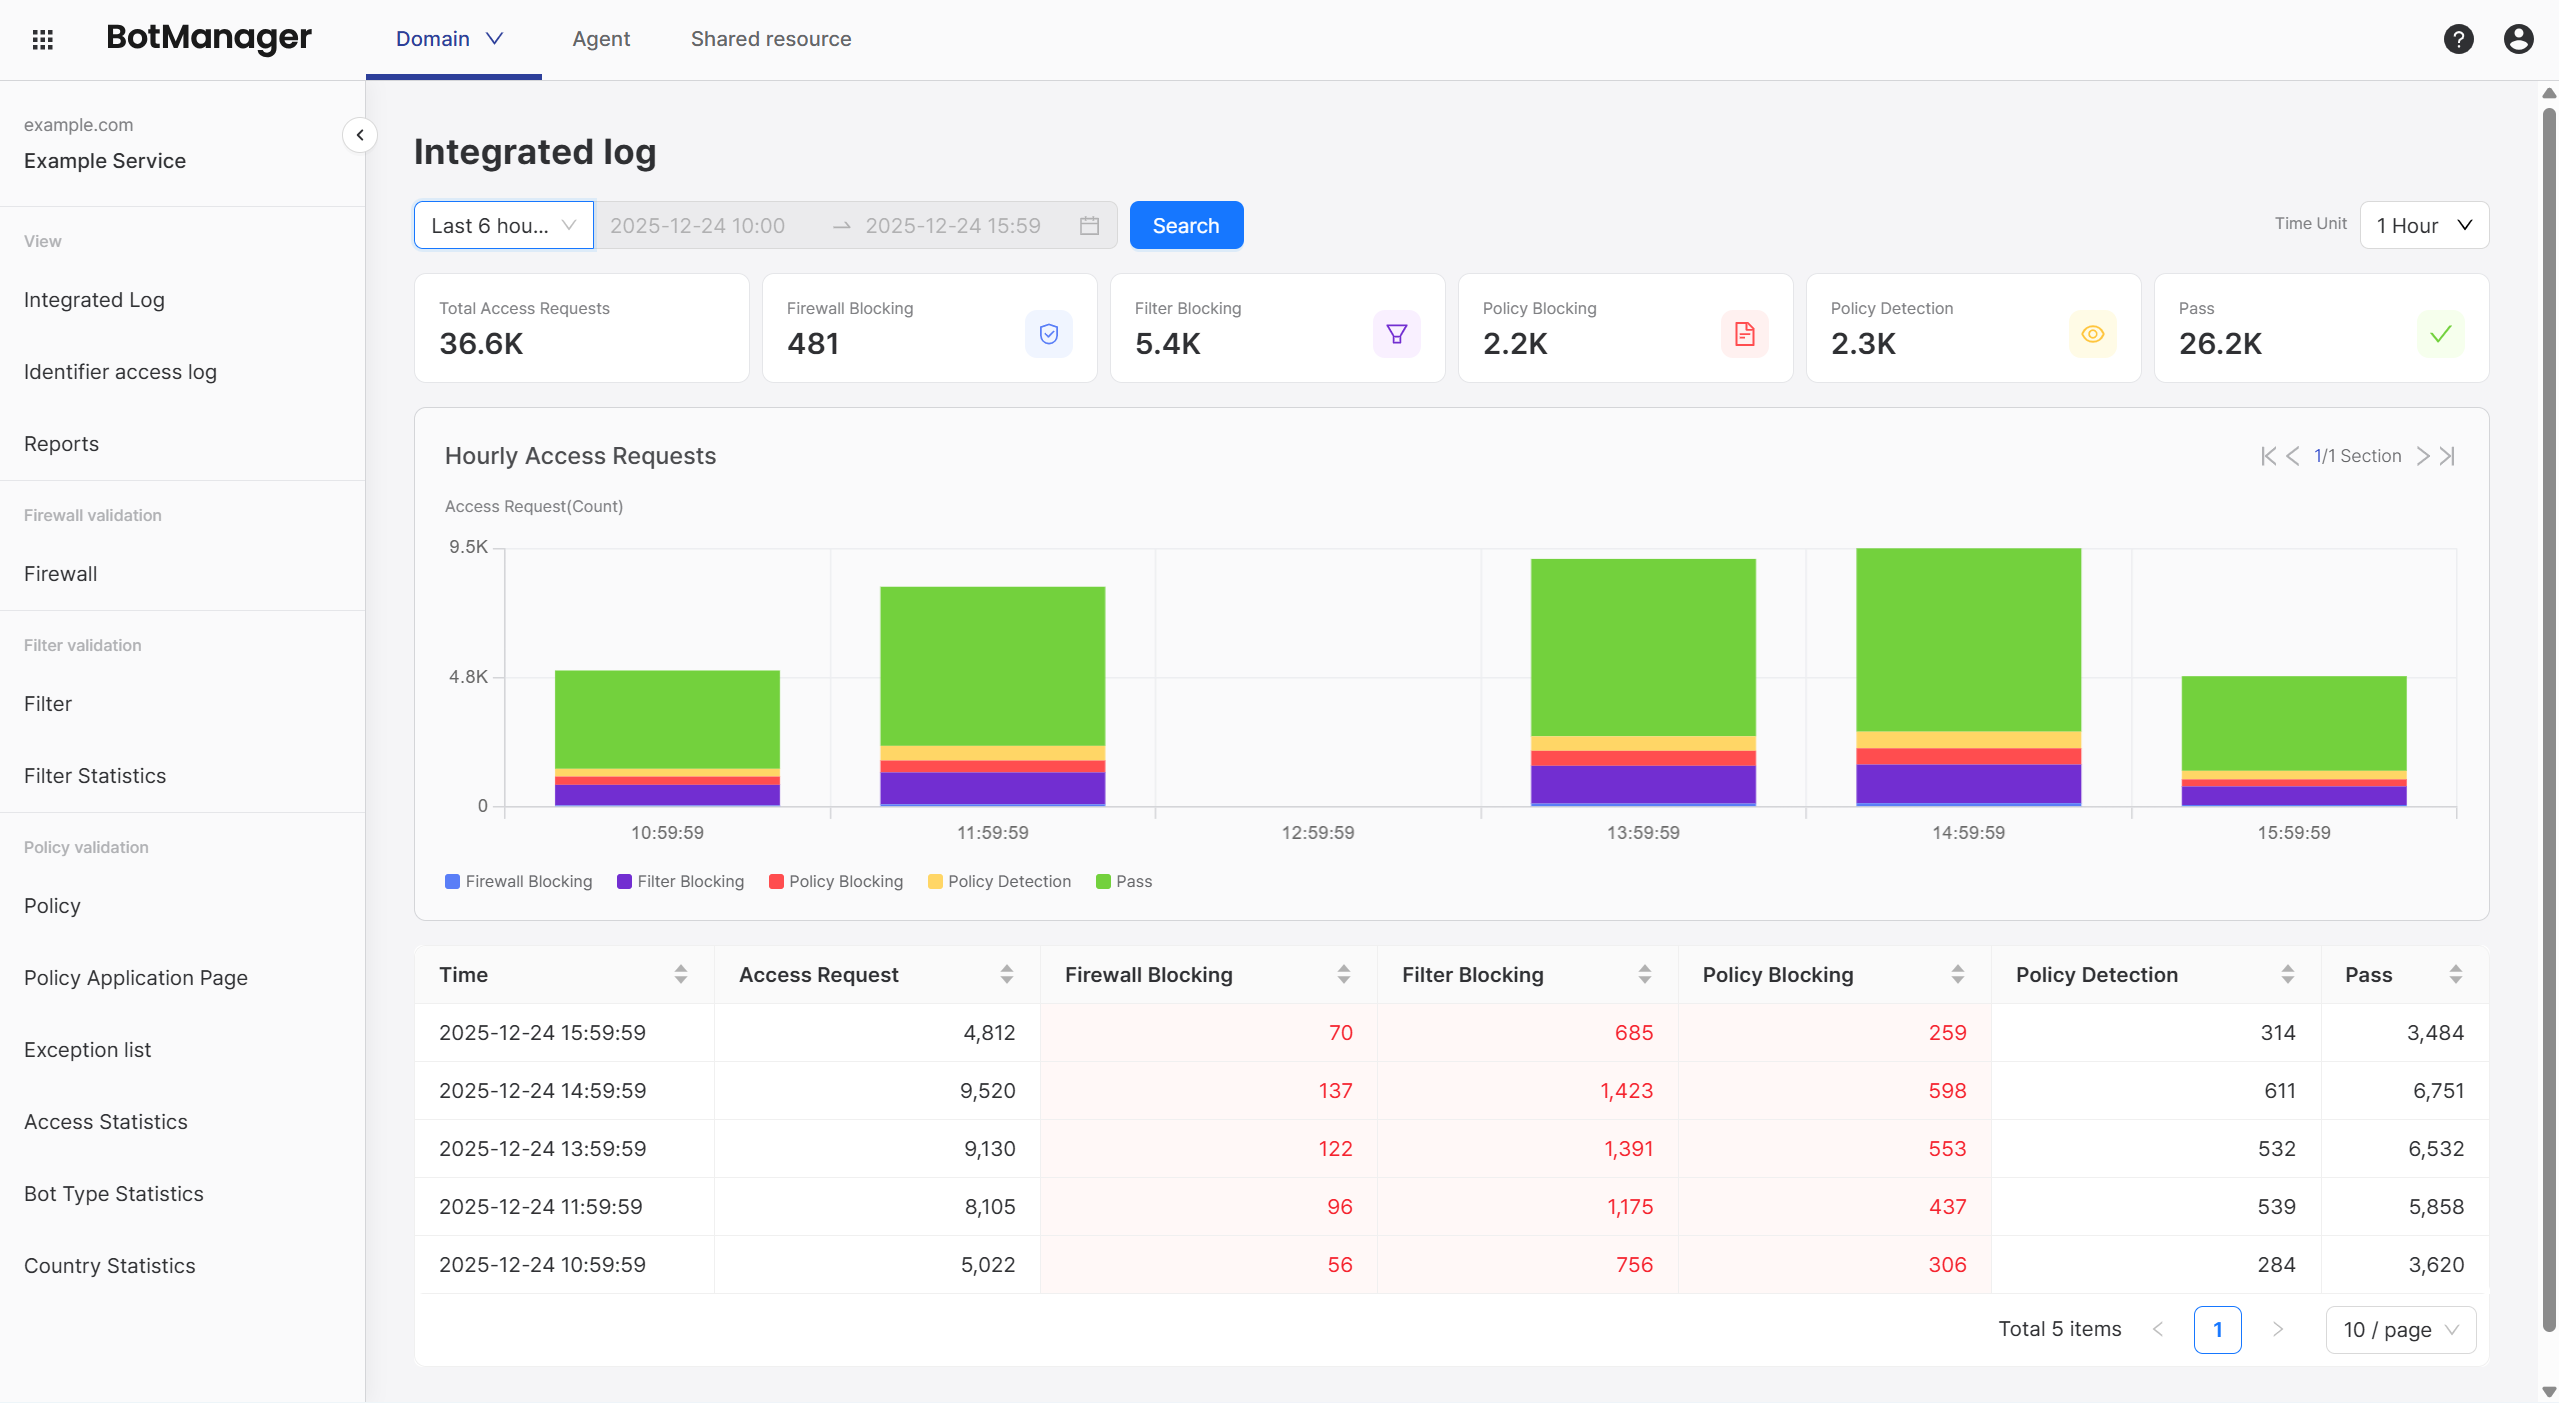
You can view detailed access request records by time period for the specified query period.
Key Components
Query Period
Set the query period from the top-left menu.
If you set the query period to longer than 1 year, graph rendering and queries may not work smoothly.
Use Reports to check long-term statistics.
Time Unit
Select 1 hour, 4 hours, 6 hours, 12 hours, or 1 day from the dropdown menu in the top-right to view aggregated values.
Access Requests by Time
Log
Aggregates total access request volume and the blocked, detected, and passed counts for each verification stage by query time period, displayed in database format.
Example:
| Time | Total Access Requests | Firewall Blocked | Filter Blocked | Policy Blocked | Policy Detected | Passed |
|---|---|---|---|---|---|---|
| 2025-12-22 15:59:59 | 100 | 20 | 20 | 20 | 20 | 20 |
Graph
Displays access request volume statistics as a bar graph according to the specified time unit. Each bar shows the Log components in different colors.
If the graph is extensive, use the section navigation button in the top-right of the graph to explore the entire graph.
When you hover over an individual bar in the graph, you can immediately view the log for that time.
Statistics Interpretation
The Integrated Log is updated at each configured time unit, making it suitable for detecting real-time traffic changes or attack attempts.
Users can identify and respond to anomalies by observing graphs rather than directly comparing log values.
The following are example scenarios based on graph change patterns. (Use the graph shape of the previous time period as a comparison group.)
1) When Total Access Request Volume Increases
Since total access request volume is represented by the Y-axis height of each bar graph, you can see changes in access request volume by comparing graph lengths.
1-1) When Blocking Rate Also Increases
When judging safety, compare blocking rates (%) rather than blocking counts, taking into account fluctuations in access request volume.
Total blocking rate is calculated as 100 - pass rate.
If the graph bar length has increased significantly while the green (passed) area size remains the same or decreases, it can be determined that most of the increased traffic consists of threatening access attempts.
Compare the blocking rate changes at each verification stage to identify the stage showing the largest increase in blocking volume.
If Filter blocking volume has increased, check Filter Statistics. If Policy detected volume or Policy blocking volume has increased, check the Access Statistics and Bot Type Statistics pages to analyze attack patterns and inspect attack paths or target pages.
1-2) When Blocking Rate is Similar or Decreases
If the request volume shown by graph length has increased but the total blocking rate is similar to before, it is likely a simple traffic increase due to an event.
For example, even if the total access request volume increased by more than 1 million between 2 PM and 3 PM, and the total blocking volume also increased by 100,000:
- If the pass rate increased from 75% -> 85%
- And the blocking rate decreased from 25% -> 15%
Then it is difficult to consider this an attack attempt since there is no significant difference from the existing pass : block ratio.
2) When Total Access Request Volume is Similar or Decreases
If the graph height decreases, it means traffic attempting to access the domain has decreased.
2-1) When Blocking Rate Increases
If the graph bar height is similar compared to the previous time but the green (passed) area has decreased significantly, it can be seen that the number of normal users has decreased while attack or abnormal access attempts have increased.
Compare the blocking rate changes at each verification stage to identify the stage showing the largest increase in blocking volume.
If Filter blocking volume has increased, check Filter Statistics. If Policy detected volume or Policy blocking volume has increased, check the Access Statistics and Bot Type Statistics pages to analyze attack patterns and inspect attack paths or target pages.
2-2) When Blocking Rate is Similar or Decreases
If both normal and malicious access attempts have decreased together, and the absolute value of blocking volume is not high, it is not considered an anomaly.
Statistics interpretation may vary depending on domain attributes and administrator discretion.
If you need help, contact STCLab technical support at support@stclab.com.